D3 Integration with Angular 15 Tutorial|Line Charts Example
Learn how to integrate the D3js framework with angular/typescript technologies and display simple line charts using static data.
D3JS is a data drive document open-source javascript library for representing data in visualized graphs.
Angular 15 is a front-end framework using component-based typescript language.
Prerequisite:
- Typescript 4.4
- Angular 13.0
- Npm - 7.11.0
- Nodejs - v14.17.0
- Angular cli 13.0.x
- D3 - 7.2.0
Setup Nodejs and Angular-cli
First, Make sure that nodejs is installed, once nodejs is installed, Run the below commands to test nodejs installation.
C:\>npm --version
v7.11.1
C:\>node --version
v14.17.0
Next is to install the latest angular-cli. Angular CLI is the command-line tool to generate the angular project. It will generate a readymade Angular application using Angular 15
npm install @angular/cli -g
Next, check the angular-cli version using the ng command below
ng --version
The next step is to create an angular project using the angular cli ng command
ng new linechartDemo
It generates Angular 15 application code files and required configuration and installs all dependencies. Install D3js npm dependency locally.
npm install d3
It installs d3 dependencies and has done the below changes.
- Installed d3 dependencies and created folders(d3,d3-array,d3-* ..etc) in root project/node_modules
- Added d3 and its version information in the dependency section of the project/package.json file
"dependencies": {
    "d3": "^7.2.0",

  }
Once dependencies are installed, start the server using the ng command.
ng serve
Please see the below diagram to access the server using the URL localhost:4200

Create a New Component
In Angular, Every functionality is represented in components. So we will create a new component for the line chart Create component for the line chart.
B:\d3Demo>ng generate component line-chart
CREATE src/app/line-chart/line-chart.component.html (29 bytes)
CREATE src/app/line-chart/line-chart.component.spec.ts (650 bytes)
CREATE src/app/line-chart/line-chart.component.ts (284 bytes)
CREATE src/app/line-chart/line-chart.component.css (0 bytes)
UPDATE src/app/app.module.ts (410 bytes)
This command does the following things.
Created below four files
line-chart.component.html - Actual command HTML changes line-chart.component.spec.ts - this is a typescript test file for a new component line-chart.component.ts - This is a typescript source file that contains component selector,templateUrl, and styleUrls and also has lifecycle callbacks methods line-chart.component.css - This file holds CSS style changes for a component
And also this command does update a few changes.
The new component is configured in your Root module i.e app.module.ts. LineChartComponent is added in the declarations section
Please see the below code for your information.
import { BrowserModule } from "@angular/platform-browser";
import { NgModule } from "@angular/core";

import { AppComponent } from "./app.component";
import { LineChartComponent } from "./line-chart/line-chart.component";

@NgModule({
  declarations: [AppComponent, LineChartComponent],
  imports: [BrowserModule],
  providers: [],
  bootstrap: [AppComponent],
})
export class AppModule {}
You can also create a component manually. But you have to be well versed in typescript coding. CLI command allows the developer job easy as it creates a prototype code for your project and adds the required components
Import D3 modules into Angular components
To use D3 functionality, You need to import d3 components into your components. The below d3 components need to be extended.
import * as d3 from "d3-selection";
import * as d3Scale from "d3-scale";
import * as d3Shape from "d3-shape";
import * as d3Array from "d3-array";
import * as d3Axis from "d3-axis";
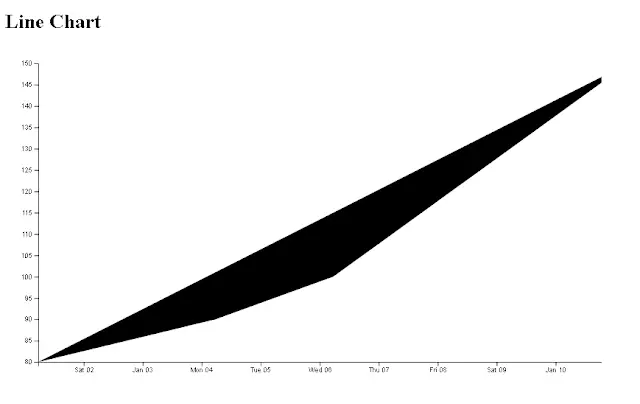
we are going to display a Line Chart using static data The name says line graph used to represent data in a series of points/markers connected by lines. The code changes are as below line-chart.component.ts
import { Component, OnInit } from '@angular/core';

import * as d3 from 'd3-selection';
import * as d3Scale from 'd3-scale';
import * as d3Shape from 'd3-shape';
import * as d3Array from 'd3-array';
import * as d3Axis from 'd3-axis';

@Component({
  selector: 'app-line-chart',
  templateUrl: './line-chart.component.html',
  styleUrls: ['./line-chart.component.css']
})
export class LineChartComponent implements OnInit {
    title = 'Line Chart';
    data: any[] = [
    {date: new Date('2010-01-01'), value: 80},
    {date: new Date('2010-01-04'), value: 90},
    {date: new Date('2010-01-05'), value: 95},
    {date: new Date('2010-01-06'), value: 100},
    {date: new Date('2010-01-07'), value: 110},
    {date: new Date('2010-01-08'), value: 120},
    {date: new Date('2010-01-09'), value: 130},
    {date: new Date('2010-01-10'), value: 140},
    {date: new Date('2010-01-11'), value: 150},
    ];

    private margin = {top: 20, right: 20, bottom: 30, left: 50};
    private width: number;
    private height: number;
    private x: any;
    private y: any;
    private svg: any;
    private line: d3Shape.Line<[number, number]>; // this is line definition

  constructor() {
      // configure margins and width/height of the graph

   this.width = 960 - this.margin.left - this.margin.right;
        this.height = 500 - this.margin.top - this.margin.bottom;}

  ngOnInit() {
    this.buildSvg();
        this.addXandYAxis();
        this.drawLineAndPath();
  }
  private buildSvg() {
        this.svg = d3.select('svg')
            .append('g')
            .attr('transform', 'translate(' + this.margin.left + ',' + this.margin.top + ')');
    }
    private addXandYAxis() {
         // range of data configuring
         this.x = d3Scale.scaleTime().range([0, this.width]);
         this.y = d3Scale.scaleLinear().range([this.height, 0]);
         this.x.domain(d3Array.extent(this.data, (d) => d.date ));
         this.y.domain(d3Array.extent(this.data, (d) => d.value ));

        // Configure the Y Axis
        this.svg.append('g')
            .attr('transform', 'translate(0,' + this.height + ')')
            .call(d3Axis.axisBottom(this.x));
        // Configure the Y Axis
        this.svg.append('g')
            .attr('class', 'axis axis--y')
            .call(d3Axis.axisLeft(this.y));
    }

    private drawLineAndPath() {
        this.line = d3Shape.line()
            .x( (d: any) => this.x(d.date) )
            .y( (d: any) => this.y(d.value) );
        // Configuring line path
        this.svg.append('path')
            .datum(this.data)
            .attr('class', 'line')
            .attr('d', this.line);
    }

}
line-chart.component.html:
<h2>{{ title }}</h2>
<svg width="900" height="500"></svg>
and the line chart is shown in the browser below

Conclusion
With this, you learned the integration of the D3js library in the Angular project. It includes an example of line charts in angular application.
